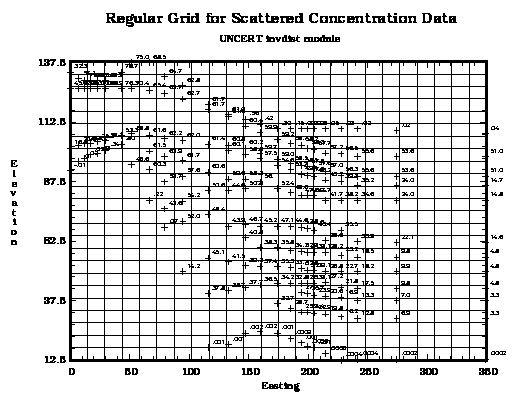
Figure 10.21: This map shows the distribution of modeled contaminant concentration values which need to be interpolated to a regular grid. The overlying mess shows one possible grid configuration. NOTE: This map was generated by contour (Chapter 11).