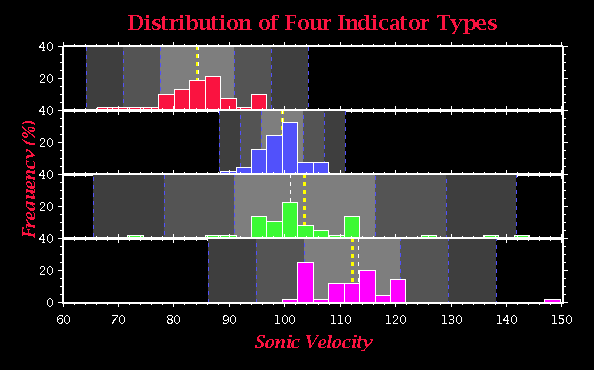
Figure 6.4: This series of histograms show how a series of related data sets within a single file can be stacked in a single graph, with the statistics for each set graphically shown.