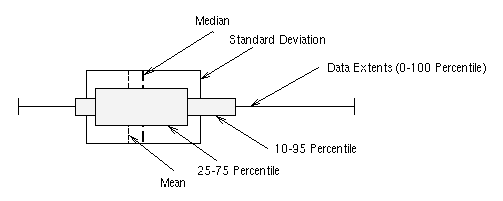
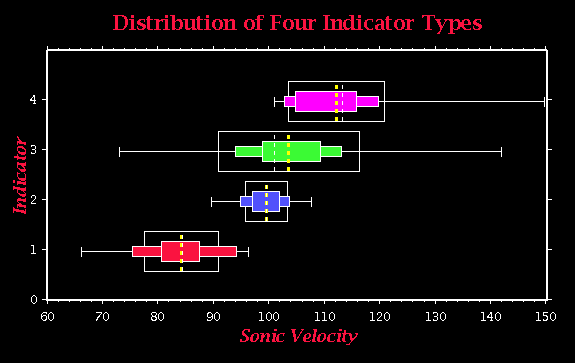
Figure 6.5a,b: Figure 5a shows the same data as Figure 6.4, but uses a box and whisker plot instead of a histogram format. It is mainly used to show the distribution of different portions of the data population. The meaning of each symbol is shown in Figure 5b.