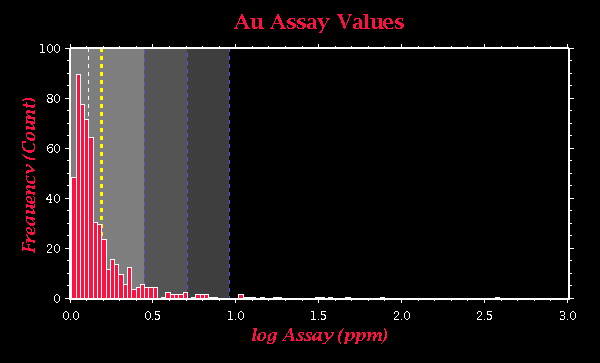
Figure 6.8: This figure demostrates several features of histo. This histogram shows the distribution of a non-transformed data set (Au - gold). The height of the individual bars represents the percentage of all the data samples falling within the given value range. The black dashed line in the center of the graph identifies the mean of the data set. The shaded bars in the background show one, two, and three standard deviations from the mean. Note that this histogram is highly skewed. Between Figure 6.4 and this figure, it is much more likely this data set is log-normally distributed than normally distributed.