|
Back to Summary
Vario:
The vario application is used for calculating one- and two-dimensional experimental semivariograms. The
package is not limited to just the classical semivariogram but will also calculate covariances, madograms,
rodograms, cross- semivariograms, etc. Analysis of the calculated values through jackknifing is also an
option. Three types of soft indicator data can be used with hard data to calculate the spatial continuity.
The application displays the measure of covariance ( (h)) versus lag. (h)) versus lag.
|
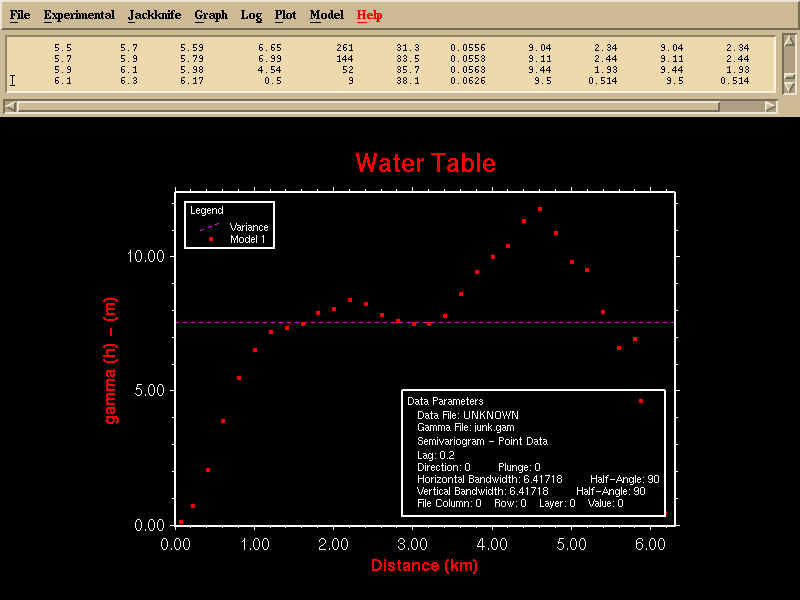
This is a basic isotropic experimental semivariogram, where the dashed line represents the data set
variance. The two legends identify 1) each line, and 2) the parameters used to calculate the
experimental semivariogram.
Click for full size image
|
 |
|
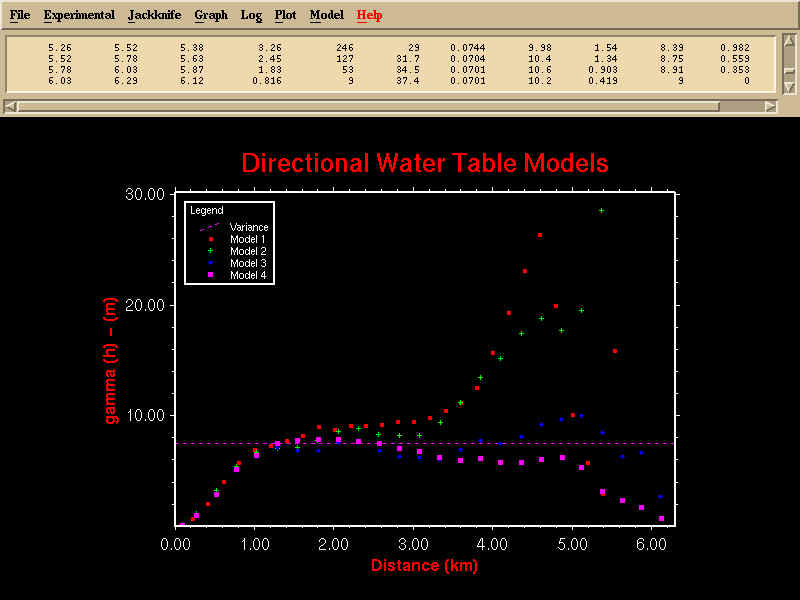
Here, four ansiotropic experimental semivariograms have been calcualted at the same time. While there
are differences at longer ranges, the models are nearly identical at the range where the lags meet
the variance. This suggests an isotropic semivariogram is justified.
Click for full size image
|
 |
|
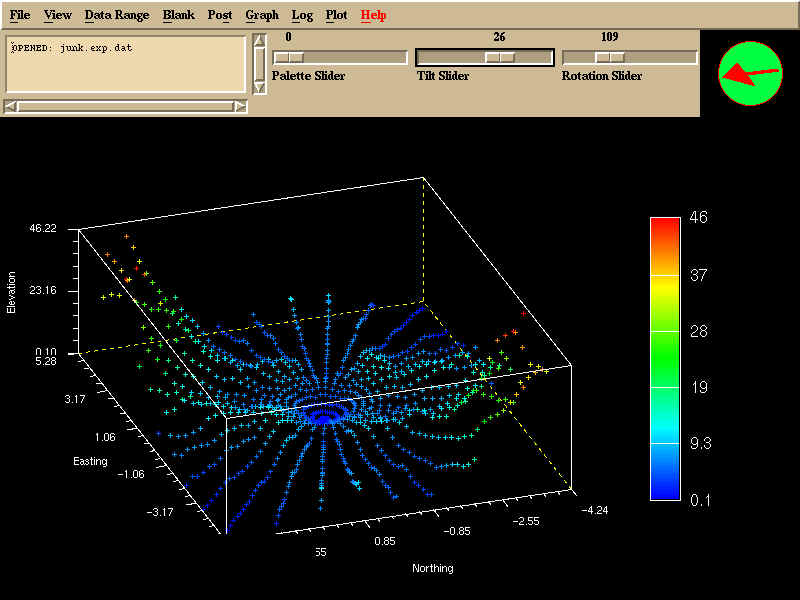
Experimental semiavriograms can be plotted in 18 directions (every 10o's), with varying
half-angles. Using this method and block, data set anisotropies can quickly be evaluated visually.
Click for full size image
|
 |
|
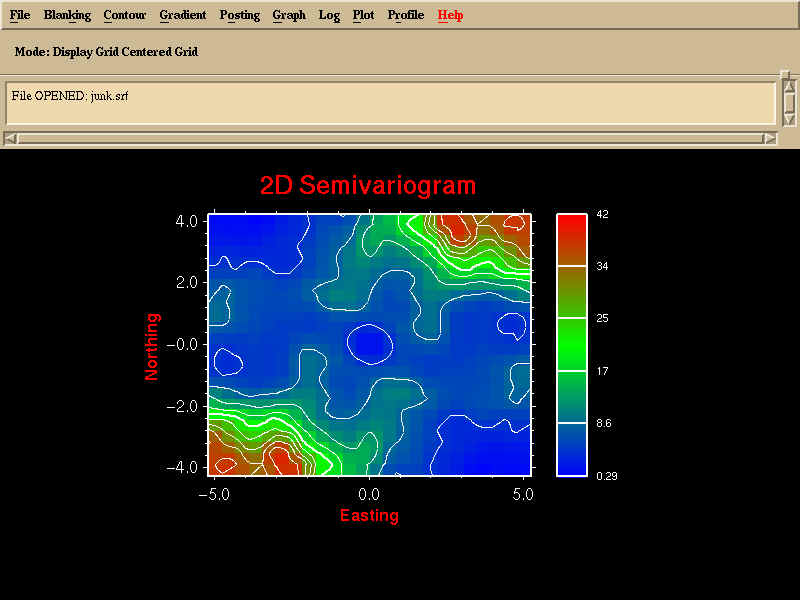
The results from the 2D calculations can also be gridded (using grid) and displayed using
contour (or surface or block). Contour also has a convienient profiling
tools allowing the user to view the conventional 1D experimental semivariogram in different directions
very quickly.
Click for full size image
|
 |
|
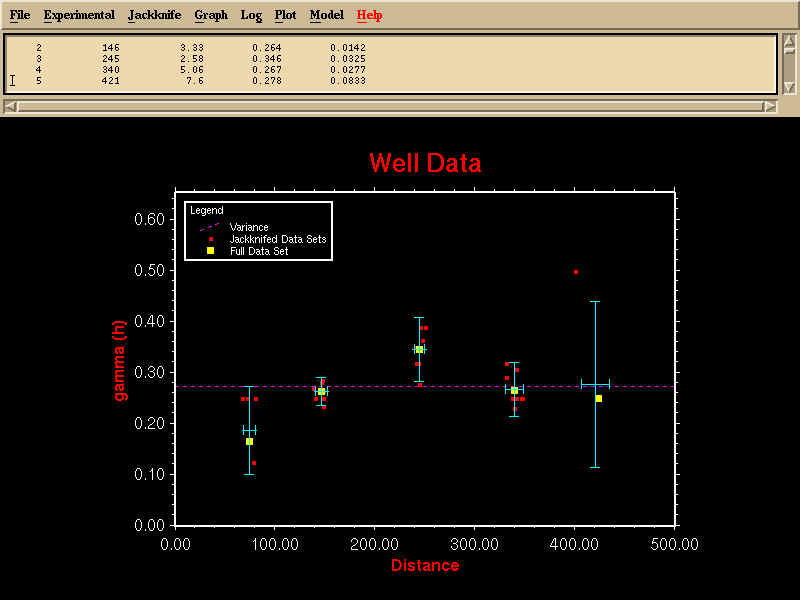
Sometimes data sets are small, and while you might calculate a reasonable looking experimental
semivariogram, small changes in the model parameters, or the gain or loss of a data point, and have
drastic results. This plot shows a jackknifed semivariogram (n experimental semivariogram are
calculated removing a different sample (n = # of samples)) and 95% error bars show the probable
range for the value of each lag estimate. If the range is narrow, one can have confidence in the
results. If the range is wide, particularly for short lags, this strongly more data is needed.
Click for full size image
|
 |
Back to Summary
|