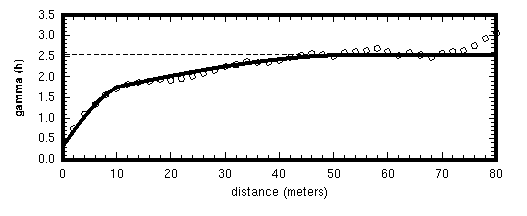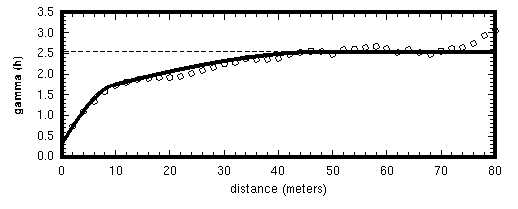
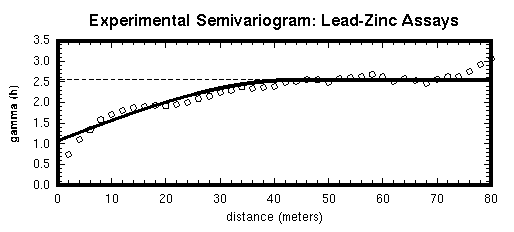
Figure 9.21a,b,c: These graphs show a series of model semivariograms fit to the data presented in Figure 9.2. a) shows an automated fit single nested spherical model. b) shows an automated fit two-nested spherical model. c) again shows a two-nested spherical model where the automated fit has been manually adjusted to improve the fit.