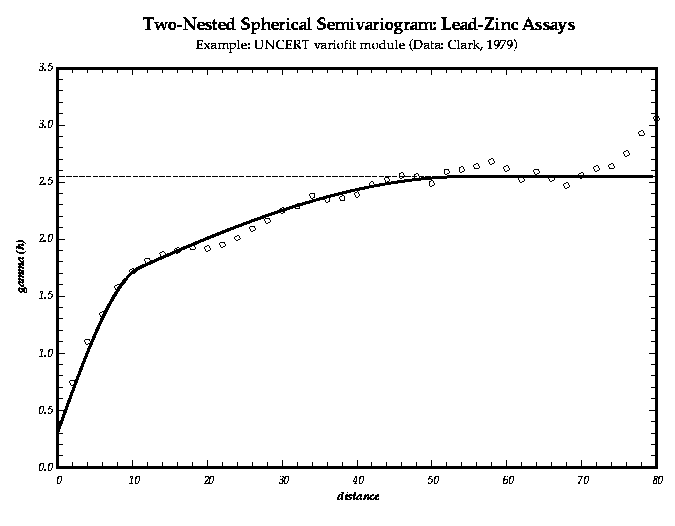
Figure 9.3: This graph shows the same experimental semivariogram as in Figure 9.2, but a two-nested spherical model semivariogram has been fit to the data. The figure was printed using the landscape option.