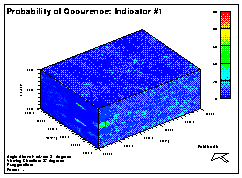

Indicator #1
| Single Zone | Two Zone |

|

|
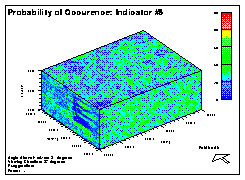
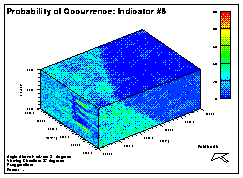
Indicator #5
| Single Zone | Two Zone |

|

|
From the maps, it can be seen that the single zone realizations do not identify any transition of indicator frequencies accross the site. The distributions are relatively constant. With the two zone realizations, though, there are very distinct differences. Because there is such a high frequency of indicator #1 in the Lyons formation, most cells have a relatively high probability of being indicator #1. For indicator #5, which was quite rare in the Lyons Formation, its probability of occurrence is also low.