Synthetic Example (Part II)

Given this zonal distribution map from a conditional simulation, several different interpretations can be created by varying the boundary rules.
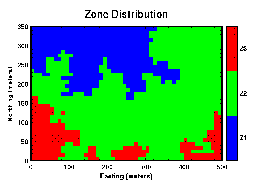
Sharp: With sharp contacts between all the zones, there is no interaction. As a result, the contacts are very abrupt.

For this example, it is convienient to think of the green zone as being river channel sands and gravels, and the red and blue zone as being overbank clay deposits. There is little reason for the zones to be related, therefore they should be treated differently. Note, the same result could be attained by modeling the site twice and merging the results together.

Gradational: If there is a gradational relationship between the green and red zone, the boundaries become less distinct. In this model there are still some sharp transitions between these zones because neighboring cells in different zones had significantly different semivariogram models, therefore the neighboring data points usedn the kriging matrix calculation were often quite different.
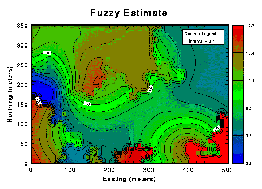
Fuzzy: Here, all the zones hacw a thin transitional boundary. As a result the boundaries tend to be fairly smooth, but at the same, the central portions on each zone maintain the nature of that zone.
Which of these models is the most accurate depends on the true nature of the zonal contacts. This is something that must be decided by the modeler.


June 1996 Guided Tour

Synthetic Example (Part II)

Given this zonal distribution map from a conditional simulation, several different interpretations can be created by varying the boundary rules.
Sharp: With sharp contacts between all the zones, there is no interaction. As a result, the contacts are very abrupt.

For this example, it is convienient to think of the green zone as being river channel sands and gravels, and the red and blue zone as being overbank clay deposits. There is little reason for the zones to be related, therefore they should be treated differently. Note, the same result could be attained by modeling the site twice and merging the results together.

Gradational: If there is a gradational relationship between the green and red zone, the boundaries become less distinct. In this model there are still some sharp transitions between these zones because neighboring cells in different zones had significantly different semivariogram models, therefore the neighboring data points used in the kriging matrix calculation were often quite different.
Fuzzy: Here, all the zones have a thin transitional boundary. As a result the boundaries tend to be fairly smooth, but at the same, the central portions of each zone maintain the nature of that zone.
Which of these models is the most accurate depends on the true nature of the zonal contacts. This is something that must be decided by the modeler.


June 1996