|
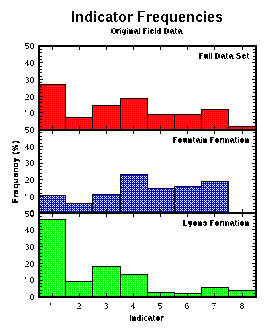
Full Data Set: By itself, it's not possible to tell if there are
sub-populations in this data set. Ideally, if the histogram is representative
of the full data set, subsets should have similar distributions. A quick look
at the distributions of the Fountain and Lyons Formations subsets suggests
otherwise.
Fountain Formation: Data in this subset tends to favor indicators #4 though #7. Lyons Formation: Data in this subset tends to favor indicators #1 though #4. Indicators #5 and #6 are very poorly represented, and indicator #8 occurs almost exclusively in this zone. |
|